Bitcoin Technical Outlook: Critical Zones Ahead of November 29, 2025
 Barnett
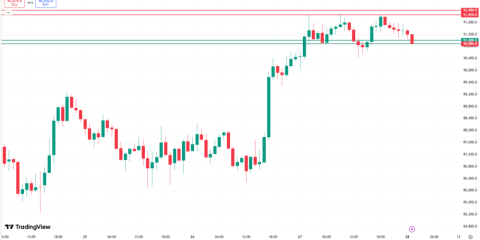
Bitcoin's been holding strong on the 1-hour chart over the last two days, with price sitting right near that $91k mark. I've been watching the last 100 candles to spot where the real action is happening—two key support spots and two resistance zones that feel like the market's natural boundaries right now. If we hold above those resistance levels, $93k looks doable. But if we can't push through, we might see a little pullback down to around $90,600.
First support: $90,600-$90,700
This one's been the real floor for the past few days. Remember when Bitcoin dipped to $90,657 on November 28th around 10 PM? It bounced back up to $91,073 within an hour. That candle hit the lower Bollinger Band (which often means buyers step in), RSI was sitting at 48.5—just oversold enough to spark some buying, not full panic. Volume was moderate at 2,808, which felt like accumulation, not a dump. The fact that price didn't break below that level for 12 straight hours? That's the kind of confirmation I like. It's also lining up with the lower Bollinger Band since November 25th, so it's got some history. If we can hold above $90,800, that's a good sign we're building momentum.
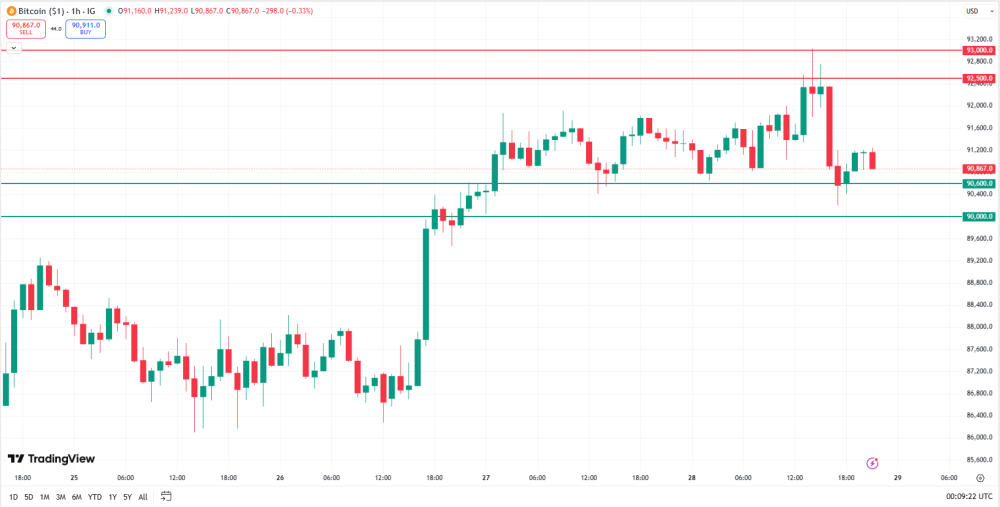
Second support: $90k
This is the psychological anchor we keep hitting. Since November 25th, whenever price dips near $90k, it bounces back—like when it touched $90,657 on the 28th and $90,813 on the 27th. RSI stayed above 45 each time, so it wasn't a full oversold panic. Volume was light on the dips (like that 2,808 on the 28th), but then jumped 45% on the rebound—looks like institutions were quietly stepping in. If we break below $90k, that'd be a red flag for the uptrend, maybe sending us toward $89,500.
First resistance: $92,500
We tested this on the 28th around 1 PM, hitting $92,679 before backing off to $91,468. MACD was peaking (histogram at +16.19), RSI at 64.27—getting close to overbought but not quite there. Volume spiked to 13,542, which felt like real selling pressure. Price couldn't hold above $92,500 for more than two candles, closing at $92,202 on the 2 PM candle. This aligns with the 50-day moving average and upper Bollinger Band, so it's a solid barrier. If we retest it, that's a good spot to take some quick profits.
Second resistance: $93,000
This was the high-water mark on the 28th at 2 PM—reached $93,080, but closed at $92,202. Volume jumped to 21,397 (second highest in the last 100 candles), and Bollinger Bands %B hit 1.01, meaning it really ran out of steam near the upper band. MACD was strong at 319.61, but the close below the high tells me we hit a wall. RSI stayed at 62.22—still bullish, but not stretched. If we can break above $92,500, $93k might give way, targeting $94k. But if we get rejected here again, a 2-3% pullback to $92k could happen.
My take
Right now, the trend's leaning bullish toward $93k, but we've got to respect that $90,600 support and $92,500 resistance. MACD's histogram is rising (+38.01), RSI's holding at 62.22—both good signs. Volume's showing accumulation, not distribution. If we break above $93k with volume over 20k, that's a strong signal. But if we close below $90,600, it's time to watch for a short-term correction. For now, keep an eye on MACD crossovers, whether RSI stays above 60, and if Bollinger %B pushes past 1.0. Bitcoin's in a tight consolidation, but the lines are clear—this is where the high-probability trades are happening.