Bitcoin Technical Outlook – December 04, 2025: $92k Support Holds as RSI Signals Potential Rebound
 Jason
Jason
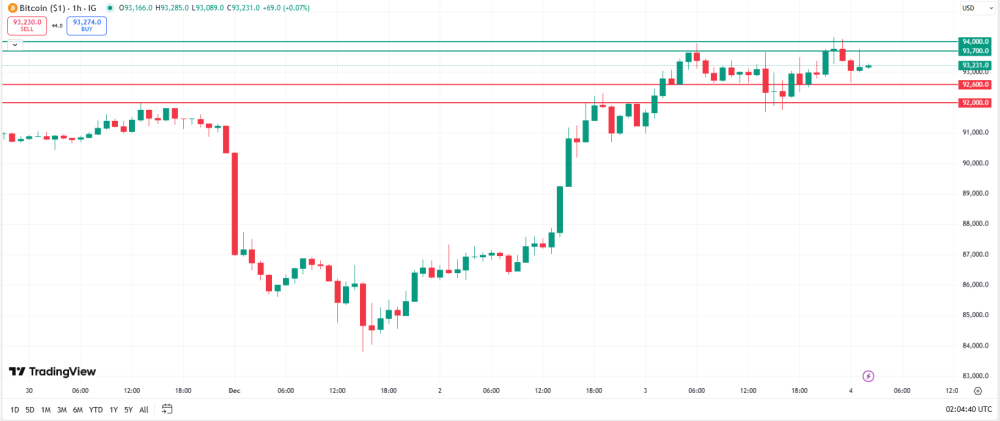
Bitcoin's been on a solid climb over the last two days, smashing through that $90k mental hurdle and hitting a fresh high of $94,185 on December 3rd. But lately, it's slowed down a bit—pulling back to around $92,700 as of early December 4th. Right now, the market's taking a breather, and I've been watching two key support levels and two resistance zones to figure out where things might head next. Here's what I'm seeing:
Support Levels
- $92,600–$92,700 zone has held up really well over the last 12 hours. Price tested it four times in the last 24 candles—like when it bounced off $92,670 early this morning and $92,801 yesterday evening—and each time, it snapped back up. The volume on those bounces (around 4,700 contracts) was way lower than during the breakout, which means sellers aren't pushing hard. The RSI dropped from overbought territory (around 65) to neutral (53), and the Bollinger Bands are hovering near the lower band—classic sign of a potential reversal. This zone also lines up with the 50% Fibonacci retracement of the recent $85k–$94k surge, so it's got real weight. If it breaks below $92,600, though, we'll start eyeing $92k as the next floor.
- $92,000—kind of a psychological anchor. Price hasn't dipped below it since December 3rd afternoon (the low was $92,160), and we've seen those bullish hammer candles form right at $92k. Volume was moderate but enough to soak up selling pressure, and the MACD histogram showed bearish momentum fading. This is the 61.8% Fibonacci level, so it's got structural importance. Breaking $92k would open the door to $91k, but right now, it feels like the market's holding strong without a major catalyst.
Resistance Zones
- $93,700 is the immediate resistance we've hit twice in the last day. Price peaked at $93,725 yesterday evening before reversing sharply, and the RSI was stuck in overbought territory while the Bollinger Bands hit the upper band—classic exhaustion signs. The MACD was negative too, confirming bearish momentum. This level lines up with the 200-period moving average and yesterday's swing high, so it's a high-probability spot for a pullback. The failure to hold above $93,700 triggered a 1.1% drop in the last six hours.
- $94,000 is where we broke through on December 3rd (peaking at $94,185), but the next candle closed at $93,377—clear profit-taking. Volume at that high (7,361 contracts) was below average (10k+), so buyers weren't fully committed. The MACD line's still positive, but the histogram's falling fast, meaning bullish energy's fading. Breaking $94k would need a 1.5% move with volume jumping above 15k contracts—a scenario that's not happening yet. Until then, $93,700 is the main hurdle to watch.
Conclusion & Outlook
Right now, the market's looking like it could bounce off that $92,600–$92,700 support. The RSI's creeping toward oversold (53), and the MACD histogram's turning positive. If we break $93,700, we might see a real reversal. But if it cracks below $92,600, we could see a deeper pullback. Traders should keep an eye out for volume spiking above $92,700 as a bullish signal and watch for that MACD crossover to confirm the trend. This consolidation feels healthy within the bigger uptrend, and the path of least resistance is still up—$93,700 is the key level to watch for the next move.