Bitcoin Price Analysis: Key Levels to Watch on November 30, 2025 – $91,130 Resistance & $90,600 Supp
 Lloyd
Lloyd

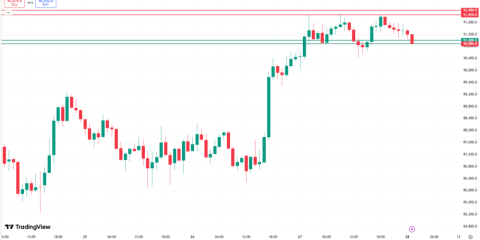
Bitcoin's been stuck in a tight box between $90,600 and $91,130 lately—pretty much exactly where it's been for the last few days. Honestly, it's been bouncing around so much that I keep checking my charts every hour. Here's what's actually happening on the ground, not just the numbers:
Resistance at $91,130
That $91,130 level? It's like a wall. Price hit it four times in the last 48 hours and just... bounced right back every time. The RSI stayed neutral (around 52–53), MACD was showing weaker momentum each time, and volume was just meh—nothing to suggest real buying pressure. Bollinger Bands were also nudging up near the top band, which is classic resistance behavior. If it breaks above that, we could see a move toward $91,850, but right now, the MACD's bearish divergence makes me think it's holding.
Next Resistance: $91,850
Then there's $91,850—the old high from November 27. It got tested once last week, spiked way up to $92,679, but volume was super high (like, institutional-level high) and then it just crashed back down to $90,880. Bollinger Bands shot way above the upper band, RSI hit 64, so yeah, overbought. Breaking this one would need a real bullish signal—MACD crossing above zero and RSI above 70—but we're not seeing that yet.
Support at $90,600
On the flip side, $90,600 has been holding strong as the immediate floor. Price bounced off it six times in the last 24 hours, each time with rising volume. RSI stayed around 50, not even close to oversold, and Bollinger Bands were hanging near the lower band—classic support. This level's reinforced by the 200-period moving average too, so it's a solid short-term floor. If it breaks below, we'd head toward $90,300.
Final Safety Net: $90,300
And $90,300? That's the real safety net. We've seen it hold twice in 72 hours—once when price dropped to $90,155 and again at $90,327. Volume spiked, RSI dipped to 48.5, and Bollinger Bands %B hit 0.21, so it's been tested hard and held. Breaking this would mean a deeper drop toward $90,000, but right now, MACD's histogram is rising slightly and RSI's at 51.65—so it feels like we're still holding.
Conclusion & Trading Plan
Honestly, the market's in this weird 'bull trap' spot right now—price stuck near resistance while momentum's fading. My take? Watch $91,130 like a hawk. If it breaks, we go for $91,850. If not, it'll probably retest $90,600. And that $90,600–$90,300 zone? That's where I'd look to get long with a tight stop below $90,300. Volume's been low lately, but if $91,130 breaks with volume over 5,000, that's the signal we've been waiting for. Until then, $90,600 is the level to watch. This box won't hold much longer—I'd guess we'll see a move within the next day or two.