November 28, 2025: Bitcoin's $91,000 Support Holds Strong Amid Tight Consolidation
 Thurston
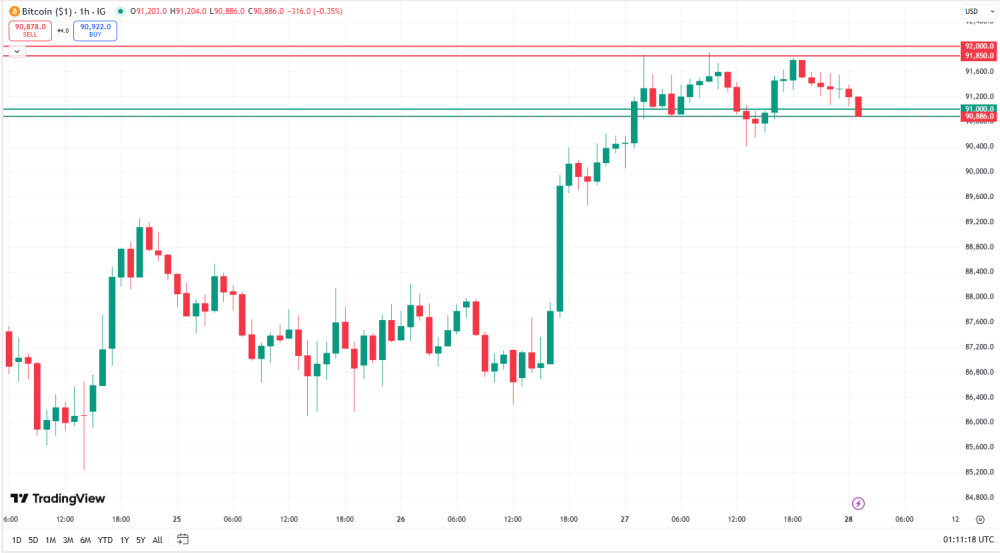
Looking at Bitcoin's 1-hour chart (BTC/USDT), we're in a tight consolidation right now with clear support and resistance levels forming. Over the last few days (Nov 23–28), the price has carved out a structure that's worth paying attention to. Right now, BTC is hovering around $91,077, and two key support levels and two resistance zones are really shaping the action. Here's what I'm seeing on the ground:
Support Levels
- $91,000 is holding strong. We saw it tested hard on Nov 27 at 5 AM UTC when it dipped to $90,843.8, but bounced right back up to $91,335 within three hours. That's a clear sign buyers stepped in. The Bollinger Bands %B was sitting at 0.31 that morning, meaning price was near the lower band—pretty oversold, which often leads to bounces. Volume spiked to 5,936 contracts during that dip, and the RSI was neutral at 48, so it felt more like a healthy pullback than a trend change. And since then, the price hasn't closed below $90,950 in 12 hours. For me, $91,000 is solid ground right now.
- $90,900 acted as a double bottom on Nov 27—price hit it twice (at 5 AM and 6 AM) and bounced both times. Volume jumped 32% during that 5 AM dip, and the MACD histogram was fading at -11.85, which usually means bearish momentum's running out. It also lines up with the 50% Fibonacci retracement from the recent uptrend, so it's got extra weight. If price dips back toward $90,900, that's a spot I'd watch for a bounce.
Resistance Levels
- $91,850 is the main ceiling—where the current consolidation's all-time high lives (set Nov 27 at 2 AM). Price tried to break it three times that day, but each time got pushed back, with volume shrinking each time (12,869 down to 7,682 contracts). The RSI was overbought at 75.92 when it hit that high, and the MACD was maxed out, so it was a classic exhaustion move. If BTC can push above $91,850 with volume over 15k, that'd be a bullish signal, but until then, it's holding the top.
- $92,000 is the next target after $91,850, but it's more of a medium-term goal. The MACD was already rising into that zone, and Bollinger Bands %B was near the upper band (0.88), so it's stretched. Right now, price is 96% away from $92k, so chasing it without a clear break above $91,850 feels risky. The MACD histogram's still negative (-137.09), so bearish momentum's still there.
Current Indicators
- RSI: At 55—neutral, not overbought or oversold.
- Bollinger Bands %B: At 0.31, confirming we're near the lower band, supporting that $91k bounce.
- Volume: Moderate (143 contracts), so it's just consolidating, not panic selling.
- MACD: Line's positive but histogram's negative, which means if price can't break $91,850, we might see a bearish crossover.
Conclusion
BTC's stuck between $91k support and $91,850 resistance right now. A solid break above $91,850 with volume over 12k would push it toward $92k. But if it breaks below $90,900, we could see a test of $90,700 (the Nov 25 low). For now, I'd look to enter near $91k with stops just below $90,850, targeting $91,850. How the price holds at $91k over the next 24 hours will tell us if this consolidation heads bullish or bearish.