Bitcoin Price Prediction: Whales' $2 Billion Short Positions Pose Hidden Threat
 Josselin
Key Fibonacci Levels Define BTC's Path: Support Weakens, Resistance Looms
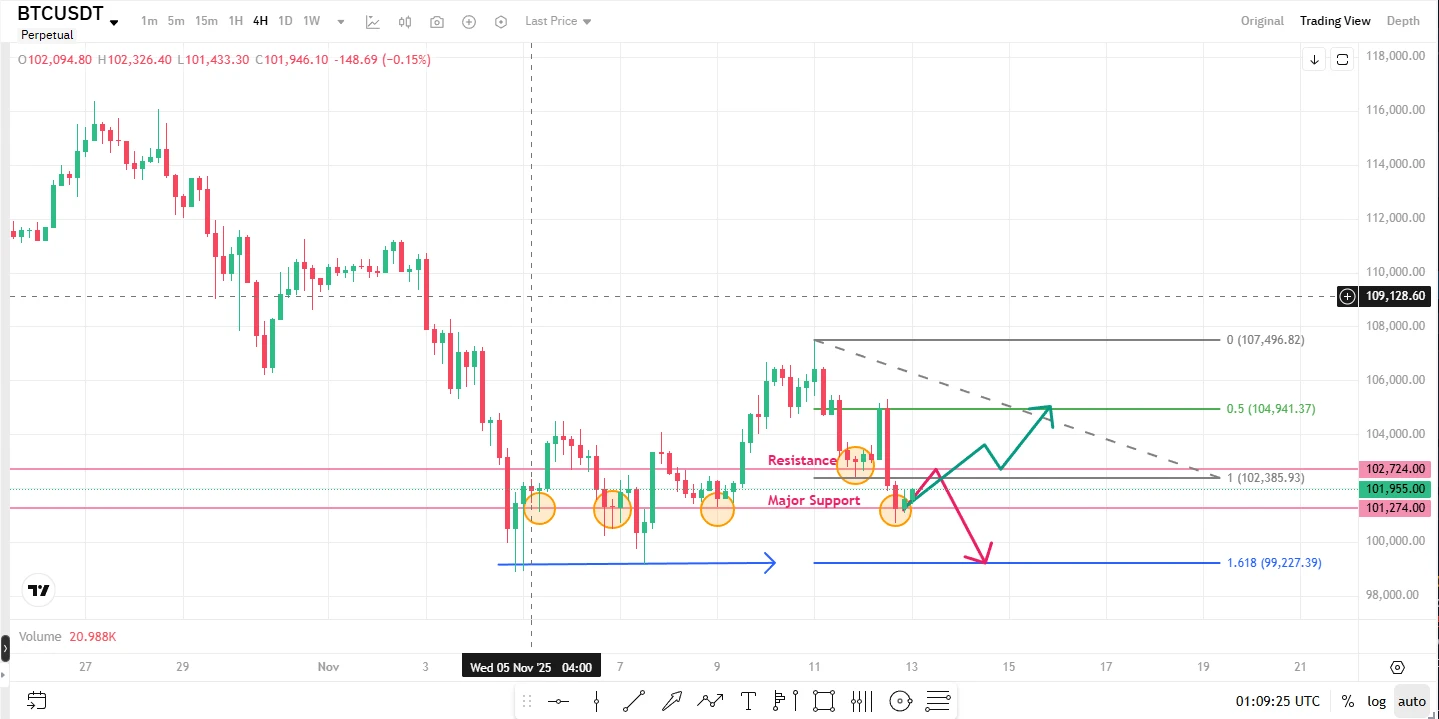
Bitcoin’s near-term direction hinges on critical Fibonacci levels, with 102,724 and 101,274 now acting as decisive zones.
On the 4-hour BTCUSDT chart, the retracement from the November high of 107,496.82 to the November low of 102,385.93 places the 50% retracement at 104,941.37—a key bounce target. The 161.8% extension at 99,227.39, meanwhile, marks a potential downside target.
Price action shows the 101,274–101,955 zone, which has held as support since November 4, is losing steam. 102,724 now acts as immediate resistance. A clean break above 102,724 would likely push BTC toward the 50% retracement level. Conversely, a close below 101,274—especially if support crumbles—could open the door to the 161.8% extension.
Watch volume closely: a meaningful spike on either side of these levels will confirm if momentum is real or just noise.
Policy Pressure vs. ETF Momentum: A Tug-of-War
With the shutdown bill vote approaching, investors are favoring assets tied to economic policy—likely weighing on BTC. The recent dip may reflect profit-taking after Wednesday’s modest bounce.
But Bitcoin’s volatility could shift quickly. Spot Bitcoin ETFs are showing signs of life, with $524 million in net inflows on Tuesday. If equities stabilize, BTC could regain momentum.
MSTR Stock Drops Below Bitcoin Holdings Value
Strategy (Nasdaq: MSTR) fell nearly 2% Thursday, closing at $227. Its $65.2 billion market cap now sits below the $6.6 billion value of its Bitcoin holdings, per Coinglass data.
The company holds 641,692 BTC, valued at ~$6.6 billion at Bitcoin’s $103,000 price. This marks a sharp decline from its previous market cap premium.
Derivatives Show Divergence: Institutions Building Quietly
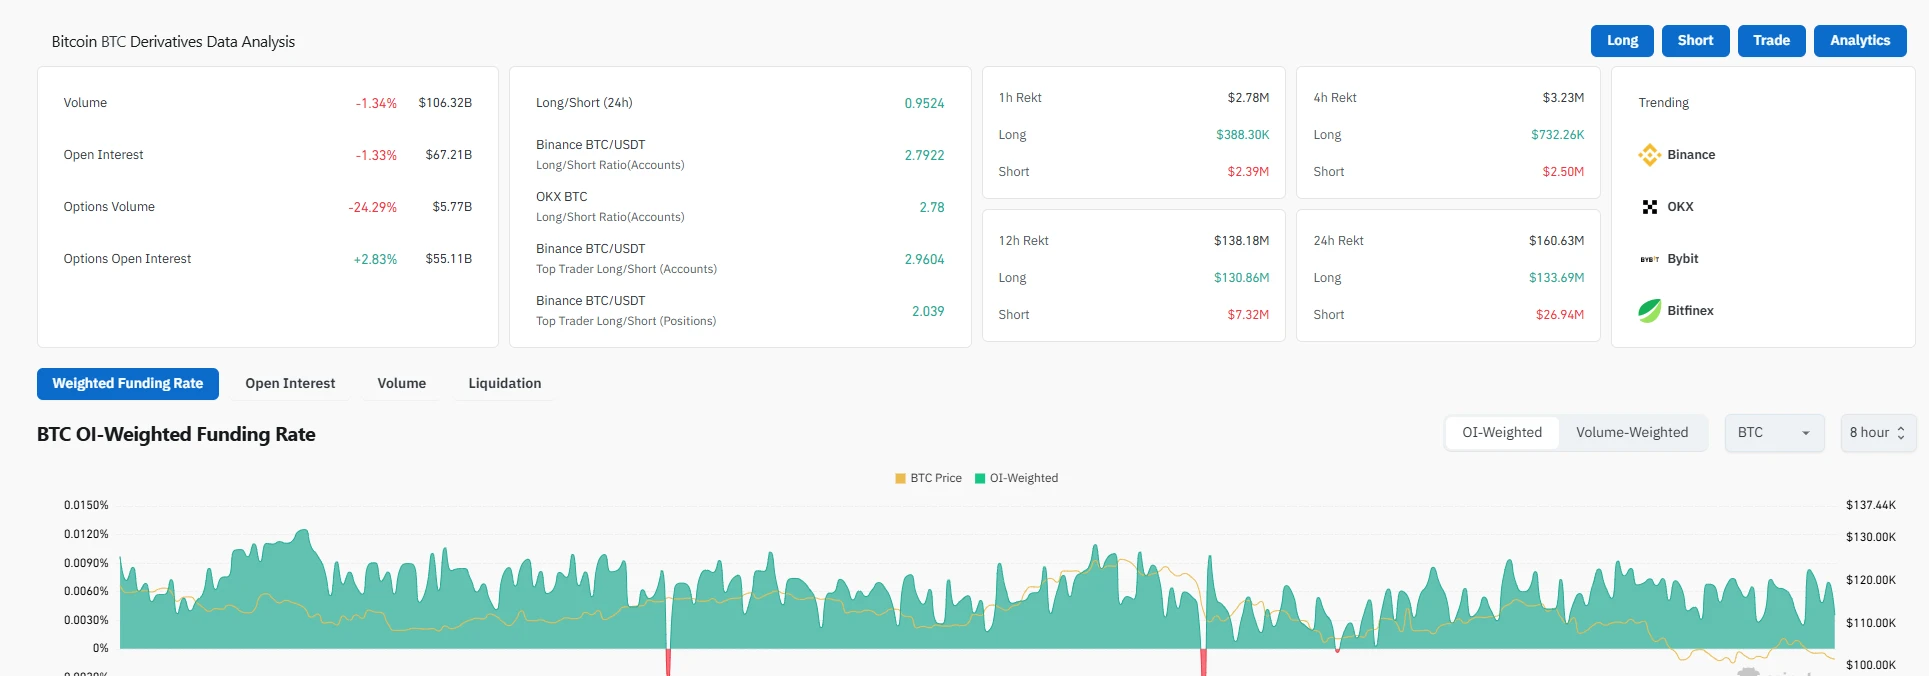
Bitcoin derivatives data reveals classic consolidation: elevated open interest ($6.71 billion) paired with subdued volume ($10.58 billion). Investors aren’t rushing out, but short-term enthusiasm has cooled.
Options markets tell a different story: volume dropped 24% to $5.7 billion, yet open interest rose 2.8% to $5.5 billion. This disconnect suggests institutions are quietly building long-term positions via options, while directional bets intensify.
The long/short dynamic adds nuance. The 24-hour aggregate ratio of 0.95 hints at slight bearishness, but exchange data tells another tale. Binance and OKX both show retail long/short ratios above 2.79—strong bullish sentiment. Yet institutions’ long/short ratio (2.04) lags behind retail (2.96). It’s “bullish on paper, bearish in practice”—a red flag for traders.
Derivatives are building momentum. Rising options open interest sets the stage for volatility, and high contract open interest means any directional move could trigger a cascade of liquidations. Monitor large account shifts and institutional options flow closely. Until the market picks a side, keeping leverage light is the smartest move.
Retail Bullish, Whales Quietly Shorting: A Classic Reversal Setup
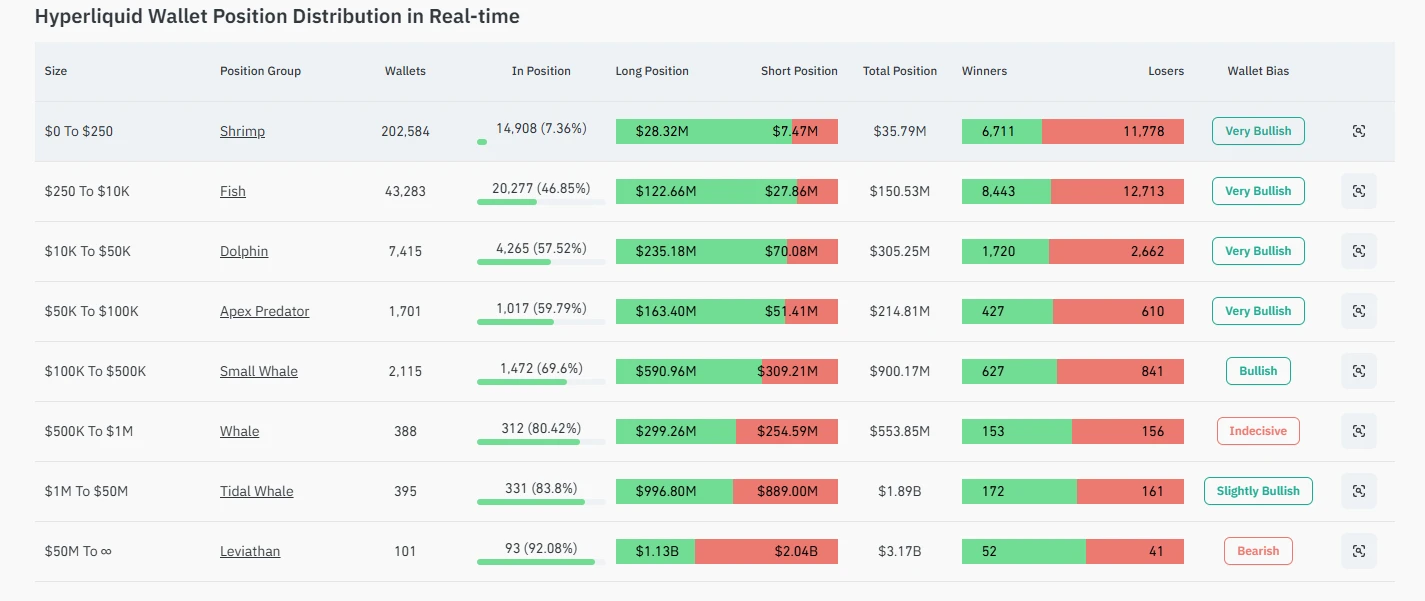
Hyperliquid’s real-time data shows a stark split: retail traders (wallets under $100K) remain bullish despite deep losses, while whales ($50M+ wallets) have shifted to cautious shorts.
Among 250,000+ users across tiers, long positions jumped from 7.36% to 59.79%—yet losing wallets vastly outnumber winners. Shrimp-tier traders (smallest positions) saw 63.7% in the red.
Contrast this with the top 101 Leviathan wallets ($3.17 billion in positions). Their short exposure ($2.04 billion) dwarfs longs ($1.13 billion)—clear bearish intent. This pattern—retail chasing rallies while whales quietly hedge—often precedes sharp reversals. Track whale positioning; it’s the true market barometer.