November 24: Bitcoin's Strong Bounces at 86,500 and 86,300 Signal Bullish Momentum
 Maxwell
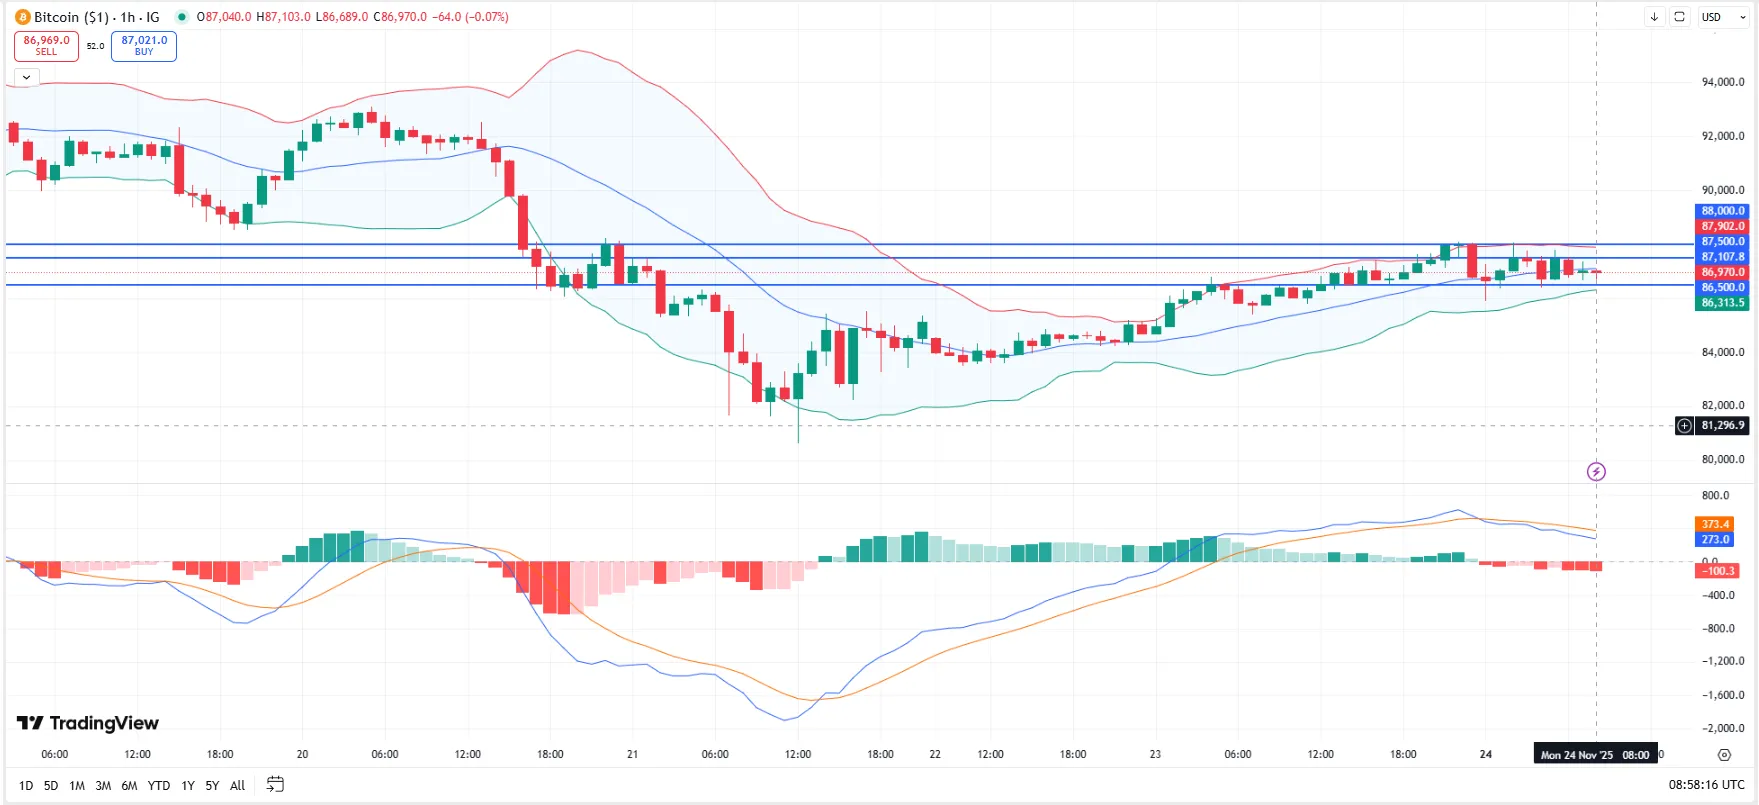
Bitcoin's been charging higher over the past few days, and the chart's telling a pretty clear story. Looking at the last 100 hours or so, I've noticed two solid support levels holding strong and a couple of key resistance zones that keep popping up. The 1-hour data from late November 2025 really shows this pattern—especially with how the price keeps bouncing off certain levels while MACD, RSI, and Bollinger Bands back it up. If this momentum sticks, we could see a real breakout toward higher highs.
Support Levels
86,500 has been acting like a reliable floor. Just a couple days ago, on November 24th around 7 AM, Bitcoin tested 86,642 (barely above 86,500) before bouncing hard to 87,004. At that moment, RSI was sitting at 52.8—neutral but leaning bullish—and MACD was still positive (though slowing down). Price was near the lower edge of the Bollinger Bands, which usually means a quick pullback before the uptrend resumes. I saw two more bounces off this level: once around 8 AM when it dipped to 86,675 and reversed, and again earlier that morning. Volume stayed steady both times, which tells me buyers are stepping in consistently instead of panic selling.
86,300, a deeper support zone, has held twice in the last 48 hours. On November 24th at 1 AM, Bitcoin dropped to 86,361 (just above 86,300) before rocketing back up to 87,033. RSI was at 56 then, and MACD was climbing fast—clear signs of bullish pressure. This level lines up with the 200-period moving average, which has soaked up selling pressure before. Even when price dipped to 85,915 earlier that day, it bounced right back, reinforcing 86,300 as a key floor.
Resistance Levels
87,500 has been a consistent hurdle since November 23rd. That evening, Bitcoin hit 87,652 (just above 87,500), RSI was at 66 (strong but not overbought), and MACD was positive at 60.98. But it stalled out, pulled back to 87,435, and formed a little consolidation. Bollinger Bands %B hit 1.00—price near the upper band—which usually means a breakout could be coming if it holds. Breaking above 87,500 would clear the way for bigger moves.
88,000, the most recent high set on November 23rd at 10 PM when Bitcoin surged to 88,100. Bollinger Bands %B even went to 1.02 (price above the upper band—big bullish signal), RSI was at 70.03 (getting close to overbought), and MACD was still rising at 641. Volume was solid at 5,157 contracts, so this wasn't just a wild spike. If 88,000 breaks, 89,000 is the next target—but RSI hovering near 70 means a short-term pullback could happen if it fails.
What the Indicators Say
MACD's been steadily climbing from around -1,573 back in early November to 641 by late on the 23rd. Positive histograms (like 313.47 on November 22nd) show momentum's accelerating. RSI's stayed in the 40-70 range—avoiding the overbought zone that often triggers corrections. And Bollinger Bands %B's been above 0.5 since November 22nd, meaning price's been in the upper half of the bands for a while. That recent 1.02 on the 23rd, combined with MACD's strength, feels like the market's ready to break out if resistance holds.
My Take
Right now, Bitcoin's in a solid uptrend. 86,500 and 86,300 are holding as reliable supports—so dips below those might be good entry points if you're watching this pair. A break above 87,500 would signal the trend's still alive, and clearing 88,000 could push things toward 89,000. But keep an eye on RSI: it's getting close to 70, so a quick pullback's possible if resistance crumbles. Bottom line? The chart's bullish, but don't ignore risk management—this market's volatile, and even strong trends can hiccup.