December 02: Bitcoin's $86,200 Bounce Signals Bullish Reversal – What Traders Must Know
 Horatio
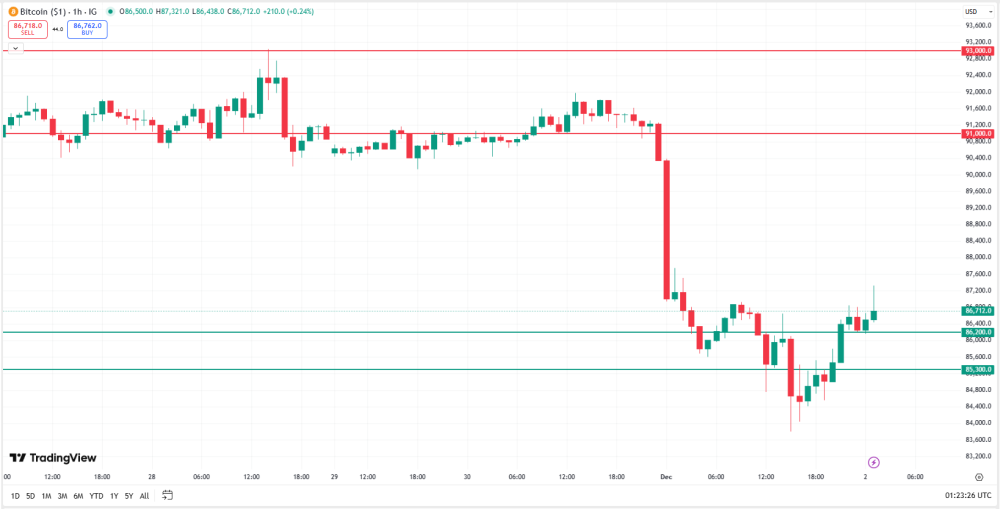
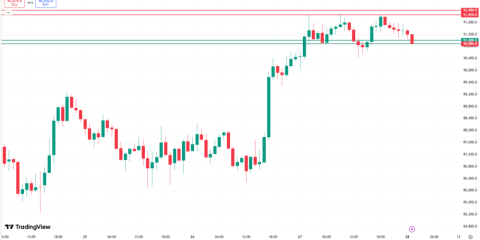
Bitcoin's been all over the place lately—wild swings from November 27 to December 2, wrapping up a 100-candle rollercoaster. It shot up, crashed hard, and then settled into a tight range. After digging through the charts, I've spotted a few key spots where price seems to bounce or stall: support zones around $86,200 and $85,300, and resistance at $93,000 and $91,000. These aren't just random numbers—they're where the action's happening. Let me break it down like we're chatting over coffee.
First up, $86,200
That's where BTC hit rock bottom on December 2 at 11 PM, dipping to exactly $86,200 before bouncing back to $86,518. RSI was sitting at 45.24—getting close to oversold—and the MACD histogram flipped from negative to positive (that's a big deal). Volume spiked to 4,728, meaning real buyers stepped in. If you're eyeing a long trade, this could be your spot, but keep a stop below $86,000. The MACD crossover's brewing, so bullish vibes are building here.
Then there's $85,300—a deeper support level
Remember when BTC crashed to $84,700 on December 1? It rebounded hard, closing near $85,396. RSI plunged to 22.21 (oversold!), and MACD's histogram stopped worsening. Volume jumped to 22,053, showing sellers ran out of steam. This level's acting like a magnet for buyers right now. If it cracks below $85,300, we could see $84,700 next, but for now, it feels solid.
On the flip side, $93,000's been a wall since late November
BTC peaked at $93,080 on November 28, but RSI was at 62.22 (getting overbought) and volume spiked to 21,397—sell pressure kicked in. Bulls need to hold above $93,000 to keep the uptrend alive, aiming for $94,000. Meanwhile, $91,000's a near-term hurdle. It hit $91,213 on December 1 but couldn't stick the landing, closing at $90,320. RSI was at 35.7 and MACD was negative, so bears held firm. Break above with volume? That's a green light for $92,000.
Bottom line
If $86,200 holds, we're leaning bullish. The MACD turning positive (yes, that's a real shift!), RSI bouncing from 45 to 54, and price hovering near the top of Bollinger Bands all point to a potential turnaround. Watch volume at $86,200—strong buying there confirms the bounce. If we break above $91,000? That's the signal to chase higher. But if price slips below $86,200? We're back to bearish, targeting $85,300. Right now, the consolidation feels like a pause before the next move—so these levels? They're where you want to be watching.