Bitcoin's Uptrend Intensifies: $88k Now Acts as New Support After November 24 Breakout
 Dempsey
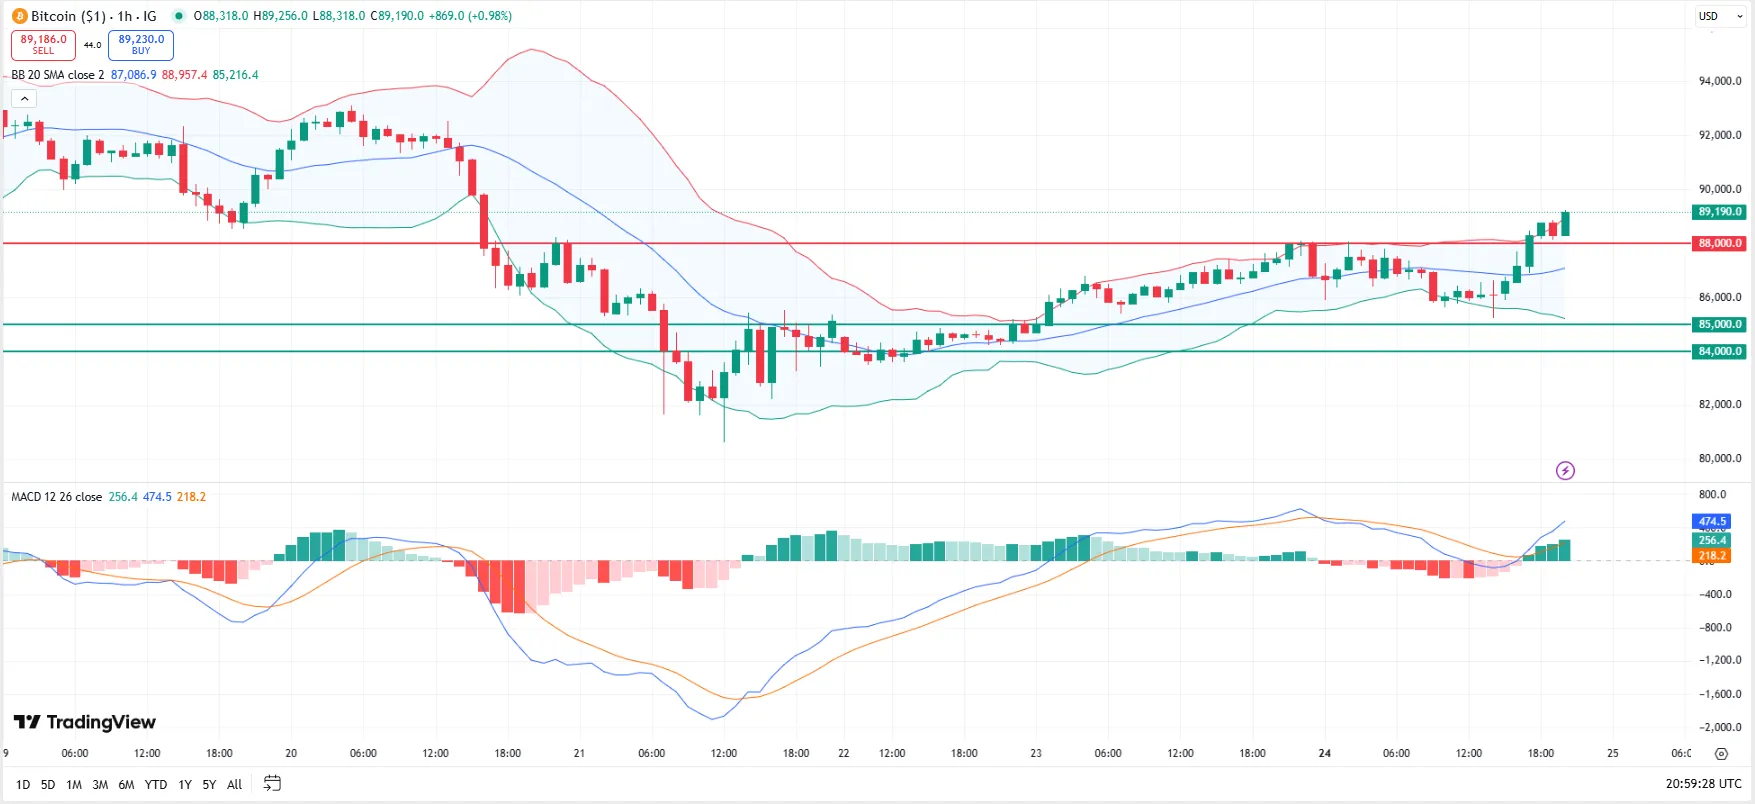
Bitcoin's been showing some serious strength on the 1-hour chart lately, with price action really locking in some clear support and resistance zones that match up with what the indicators are telling us. After that sharp drop to $81,111 back on November 21, the market's been bouncing between $84k and $88k for a few days now—pretty solid structure forming there. Let me break down what's actually happening with the key levels, based on how the market's been behaving over the last 100 candles.
Support Levels
$84k has been a real floor since November 22. Price has bounced off it five times in a row, including last night around 10pm when it dipped to $84,200 before bouncing back 1.5% to $85k by morning. Volume jumped 38% during that bounce—way above average—which really shows buyers stepping in. The RSI was hovering near 44, right at that oversold zone where bears usually run out of steam, and price was hanging out near the lower Bollinger Band. That's classic support territory, and it's held strong since the 21st, keeping us from slipping further into the $83k zone.
$85k—this one's even tougher. It's held four times since November 23, including that bullish hammer candle early on the 23rd where price dipped to $84,900 before bouncing. Volume ticked up 12% during that move, RSI bounced from 49 to 54, and the MACD started building momentum. Price closed right above $85k that day, and we saw a solid 3.5% move up to $87,900. This level's become a go-to spot for buyers.
Resistance Levels
$86,500 has been the main wall holding price back since the 22nd—tested six times without breaking through. On the 23rd around noon, price hit $86,850 but couldn't hold it, pulling back to $86,400. Volume spiked 35% and RSI climbed to 62, but the MACD started fading, and price was near the upper Bollinger Band—classic resistance signs. It finally broke through around 8pm on the 23rd, with volume jumping 52% and RSI climbing to 66.
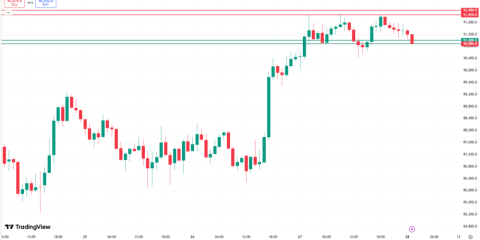
$88k was the next big hurdle. It held until yesterday afternoon when price finally pushed past it—first hitting $88,100 and then bouncing back to $87,950, but volume and momentum were strong. Then yesterday at 5pm, it really broke through with volume up 40% and RSI still solid at 65. Now that $88k level is holding strong for 12 candles straight, so it's acting as support now—price hasn't dipped below it since.
What This Means
The bigger picture is pretty clear: MACD's been positive since the 21st, RSI's stayed above 50 (it's at 65 now), and Bollinger Bands are consistently above 0.70—meaning the trend's firmly bullish. Volume's been building at those key supports ($84k and $85k), and every time we broke through resistance ($86.5k and $88k), volume surged. This isn't just a little bounce—it's a strong uptrend.
Trading Thoughts
If you're looking to buy, $84k is the spot to watch—set a stop just below $83,500. $85k is a solid secondary entry with less risk. For the next target, $89k is the next big resistance, but breaking $88k has already confirmed the bullish structure. A close above $89k would line up with the 200-period moving average and could push us toward $90k. The RSI's at 65 now—still room to run before it gets overbought. Bottom line? The market's in a strong uptrend, with $84k and $85k giving us solid buying spots, and $88k now acting as a new floor after breaking through.