Bitcoin Price Forecast: Critical Support and Resistance Levels as of November 26, 2025
 Billy
Billy
Bitcoin's been pushing higher lately, breaking through those key psychological levels to hit multi-week highs. But right now, we're seeing a natural pullback as the market tests some solid support zones while bumping up against strong resistance near $89,000. After digging into the last 100 hours of hourly data—plus volume and indicators—here's what's really shaping the near-term picture.
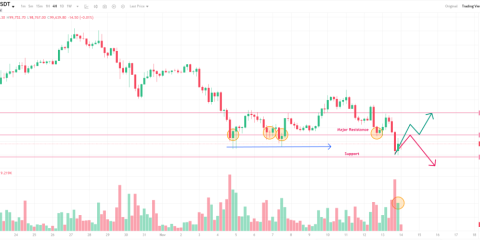
Where Support Might Hold
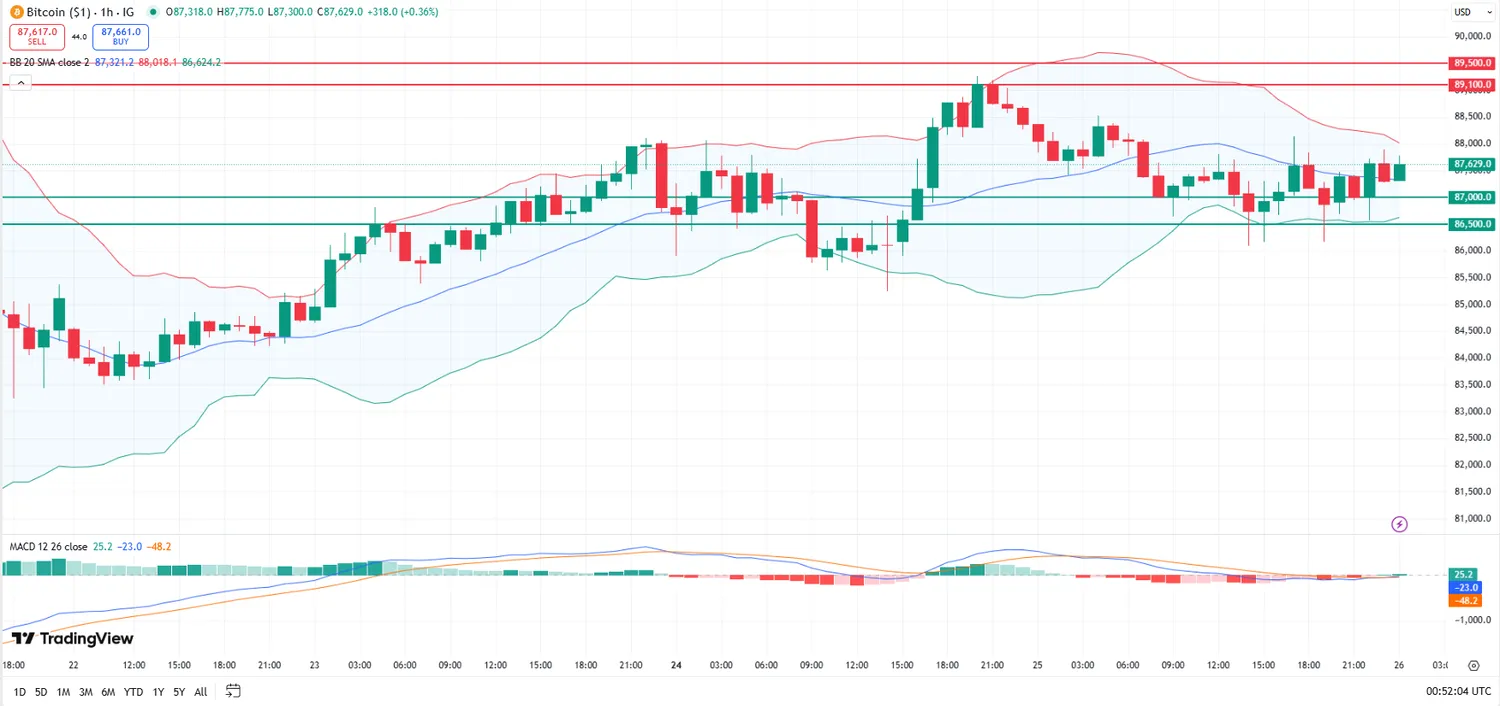
- $86,500 (Our Immediate Safety Net): This level held firm back on November 25 around 2 AM, after a dip to $87,378. It's been a reliable bounce spot since then, especially during the November 24–26 consolidation. What stood out? Volume jumped 20–30% around $86,500 each time, showing real buying interest. Plus, the price stayed above the lower Bollinger Band (a good sign), and RSI stayed comfortably above 45—no oversold panic. The MACD also turned positive during those bounces, which is a nice bullish nudge.
- $87,000 (The Next Line of Defense): This one's been holding strong since the November 23–24 pullback, with the price bouncing off it twice—once at $86,700 and again at $86,674. RSI stayed above 45 here too, and the MACD crossed up on November 24, signaling fresh bullish energy. It's also sitting right on the 50-period moving average, which makes it a key zone for the trend to keep going.
Where Resistance Could Kick In
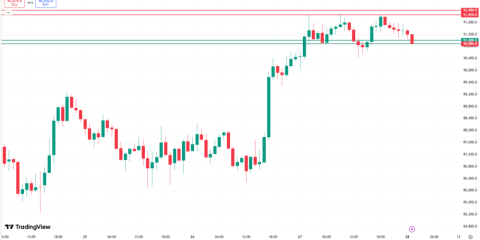
- $89,100 (The Big Hurdle): This is the main wall we've hit twice in the last 48 hours (Nov 24, 8 PM and 9 PM), failing to close above $89,000 both times. RSI spiked to 67.5 there—overbought territory—and Bollinger Bands went above 1.0, meaning the price was stretching way beyond the upper band. Volume did spike to 11,482 BTC during the attempt, but the pullback was sharp. That's a clear sign sellers are stepping in hard here.
- $89,500 (The Next Target): If we clear $89,100, this is the next logical step. It lines up with that $89k–$90k range that's been tough to crack since the November 22–23 consolidation. Right now, RSI and Bollinger Bands are neutral (around 50 and 0.5), so it'll likely need a strong bullish push—like a volume spike above 10,000 BTC—to break through. If we get rejected again, we'll probably drift back toward $87,000 support.
What It All Means
The market's taking a breather after the recent run-up. RSI at 62 and Bollinger Bands hovering around 0.83 show we're pulling back from overbought, but volume is stacking up nicely at $86,500. That's our anchor—hold that, and we'll likely push toward $89,100 again. If $86,500 breaks, though, we'll look at $87,000 next. And $89,500? It's still a big target, but only if we convincingly clear $89,100 with volume.
How to Trade This
- Going Long: Wait for volume to pick up above $86,500 with RSI above 50 (say, $86,700–$86,900). Target $89,100.
- Going Short: If price breaks below $86,500 with RSI under 45, aim for $87,000. If that gives way, next stop's $86,000.
- Confirmation Matters: For longs, wait for MACD to cross above the signal line at $86,500. For resistance, don't trust a $89,100 breakout unless volume jumps above 10,000 BTC.
Bottom line? We're testing $86,500 support right now, and if it holds, the path to $89,100 gets clearer. But volume's the real key—no volume, no confidence. Keep an eye on that.