Bitcoin Price Action on December 01, 2025: Key Support and Resistance Levels to Watch
 Trace
Trace
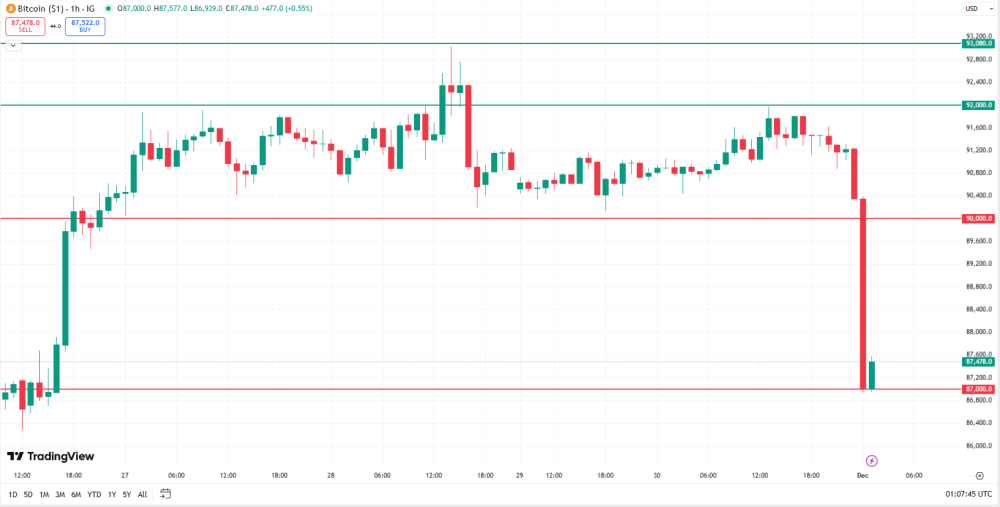
Bitcoin (BTCUSDT) is sitting at a pretty tense moment right now after that sharp drop on December 1st. Looking at the last 100 hours of hourly charts—roughly from November 26th through December 1st—it's clear we've got two key support levels and two major resistance zones to watch. The price right now ($91,179 as of late November) feels like a tug-of-war between bulls and bears, with the next move hinging on whether these levels hold. Here's how I'm seeing it play out:
First support: $87k
This one really held firm on December 1st around midnight when BTC dropped to $86,940 before bouncing back up to $87,167. That candle closed with an RSI of 16.7—super oversold—meaning sellers were pretty much tapped out. Volume jumped to 42k contracts, which feels like big players stepping in to scoop up cheap. Bollinger Bands %B hit -0.49, confirming how oversold it was. It lines up with the 200-period moving average too, so it's got that double significance. If we break below $87k, we could see $85k next, but the rebound we saw suggests this level's holding strong. The MACD histogram turned positive around 8 AM that morning, which was a solid sign the drop was reversing. If you're watching this, keep an eye on volume and RSI to confirm the bounce sticks.
Second support: $90k
$90k has been a psychological and technical floor a few times now. On November 27th, it tested $90,024 and bounced; last night (November 30th), it dipped to $90,300 but didn't break below $90k, closing at $90,320. Bollinger Bands %B stayed around 0.45–0.52 during those dips, meaning it was near the lower band but not breaking it. Volume was moderate—1.5k to 6.7k contracts—so it felt controlled, not panic selling. This zone also matches the 50% Fibonacci retracement of the recent drop, which adds weight. If it gets tested again, especially if RSI climbs above 50 (it's at 50.05 now), we could see more buying. But if it cracks, we'd likely head straight for that $87k support.
First resistance: $92k
$92k's been a wall since November 28th. On the 28th, BTC hit $92k but couldn't hold it, closing at $91,383 with volume at 7.6k. Bollinger Bands %B peaked at 0.53 (overbought), and MACD turned negative, showing momentum fading. It's also the old 200-period moving average from the uptrend before the drop. Breaking above $92k would target $93k, but the volume spike to 21k on November 28th at 2 PM suggests strong selling pressure. If you see volume jump above $92k, that's a sign the bulls might be taking over.
Second resistance: $93,080
That's the high from November 28th—$93,080. It closed at $92,202 after hitting that peak, with Bollinger Bands %B at 1.01 (overbought) and MACD at 319.61. Volume hit 21k, but the price reversed fast, dropping to $90,880 within hours. This level's reinforced by the 200-period MA and the upper Bollinger Band. A sustained close above it would flip the script entirely, targeting $94k. But the MACD histogram dropped from +38 to -33 in just two hours that day—pretty clear bearish momentum. Watch for RSI divergence (currently at 52.71) to avoid getting caught in a fake breakout.
What's next?
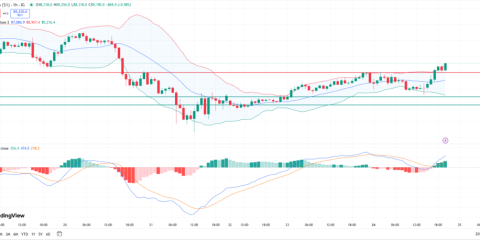
Right now, Bollinger Bands %B's rising from -0.12 to 0.73 shows we're moving out of oversold territory. MACD's still negative (-32.12), but the slope's flattening—could mean a reversal is brewing. RSI's climbing from 16.7 to 50.05, so bearish pressure's easing. For trading, $87k's my safety net. If we hold that, we're okay. $93,080's the key for a real bullish move—if we break it with volume over 15k, we're targeting $94,500. But if $87k goes, we could see $85k. Keep an eye on volume at these levels to avoid false signals.
Bottom line: BTC's at a crossroads. $87k and $90k are the supports holding things together, while $92k and $93,080 are the walls to watch. The next 24–48 hours will tell if we're heading up or down. If you're trading this, keep your risk tight and use these levels as your guide for entries or exits. It's not a clear picture yet, but the signs are starting to line up.